

Bullish Trend
Green channel highlights the move up—Start BUY at the turn, Stop BUY when momentum rolls over.


With Lukisan Emas
A multi-timeframe indicator for XAUUSD that combines M15, M30, H1, H4, and D1 analysis directly into the candle color, so there's no need to switch between multiple charts.
Green channel highlights the move up—Start BUY at the turn, Stop BUY when momentum rolls over.
In a flat range, labels call out traps and false breakouts—so you wait for a real move instead of chasing every wick.
Red zone marks the drop—Start SELL at the peak, Stop SELL when price settles into consolidation.
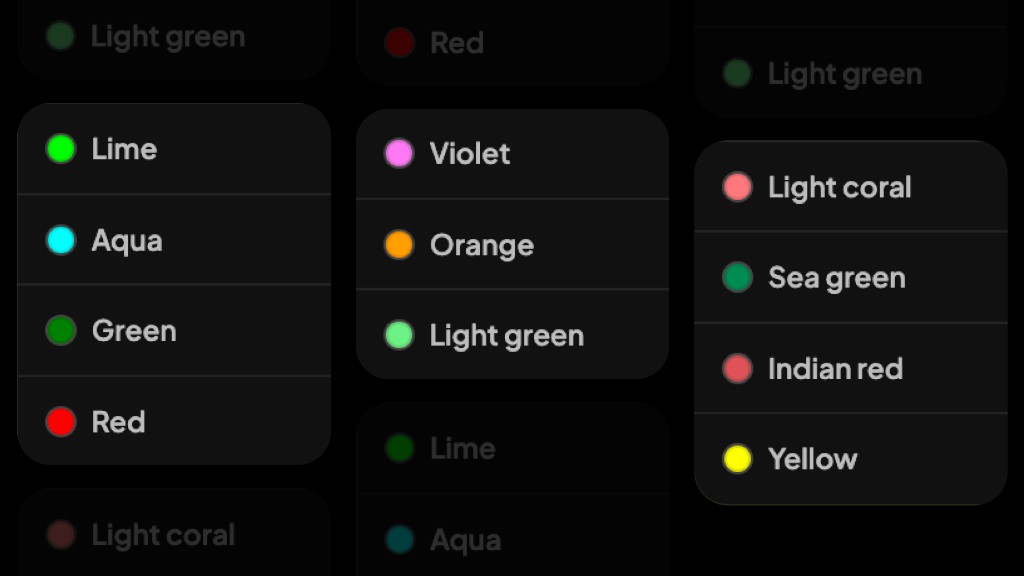
Every candle is colored by the current market condition, from strong trend and correction to trap zones and sideways. Direction and setup quality are clear at a glance.
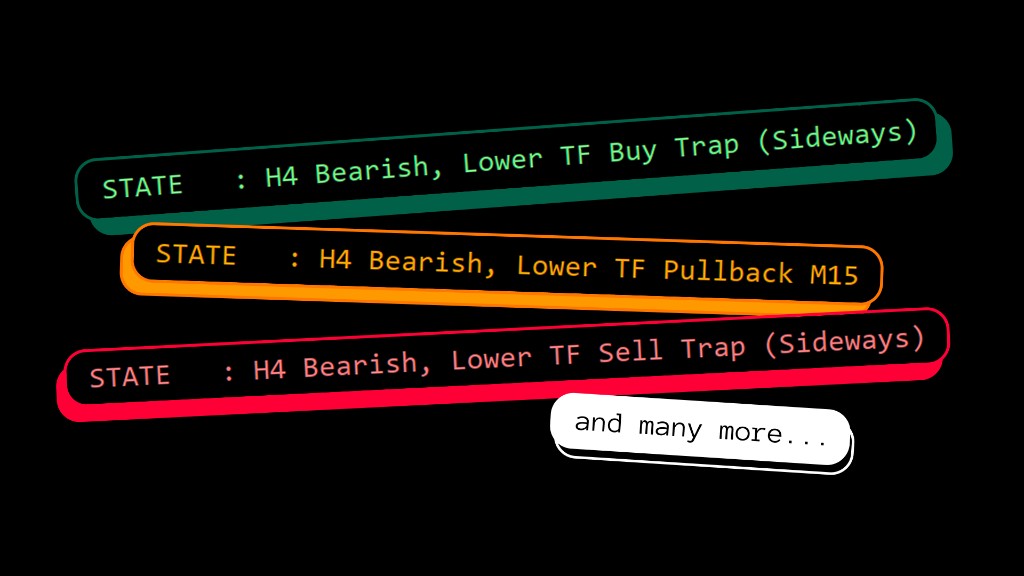
The H4 trend is compared with M30 and M15 on every candle. Even on an M15 chart, you always know where price stands against the bigger trend.
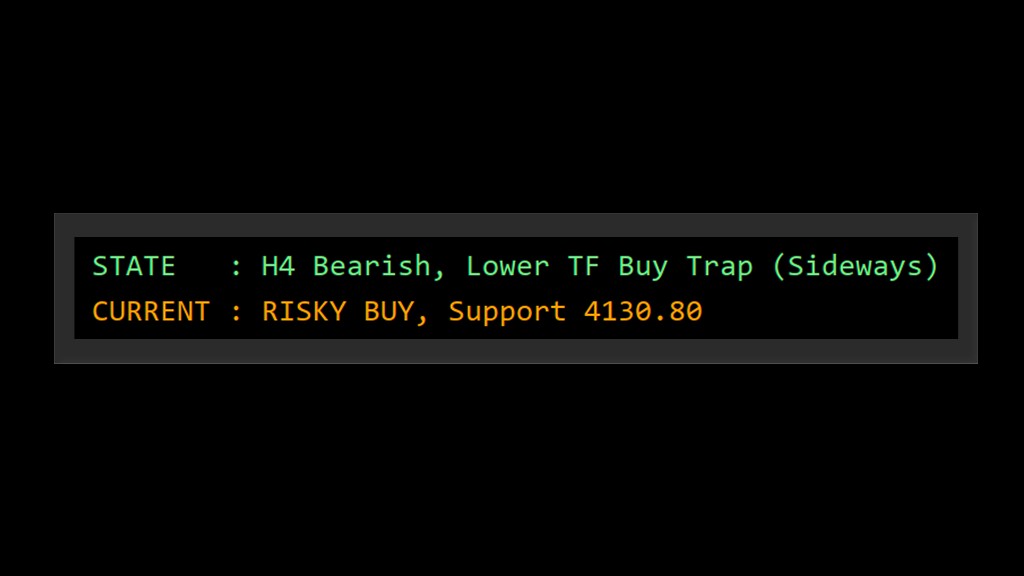
STATE shows the H4 trend and the lower-timeframe condition, while CURRENT shows the suggested action and key price level.
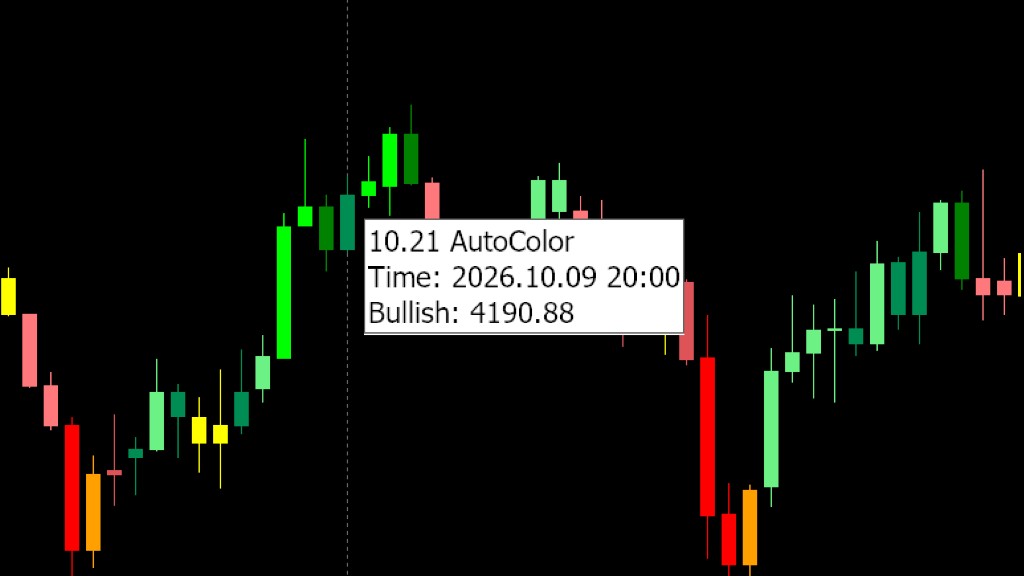
Hover over or click any historical candle, and the panel instantly shows that candle's condition. Great for learning and trade review.
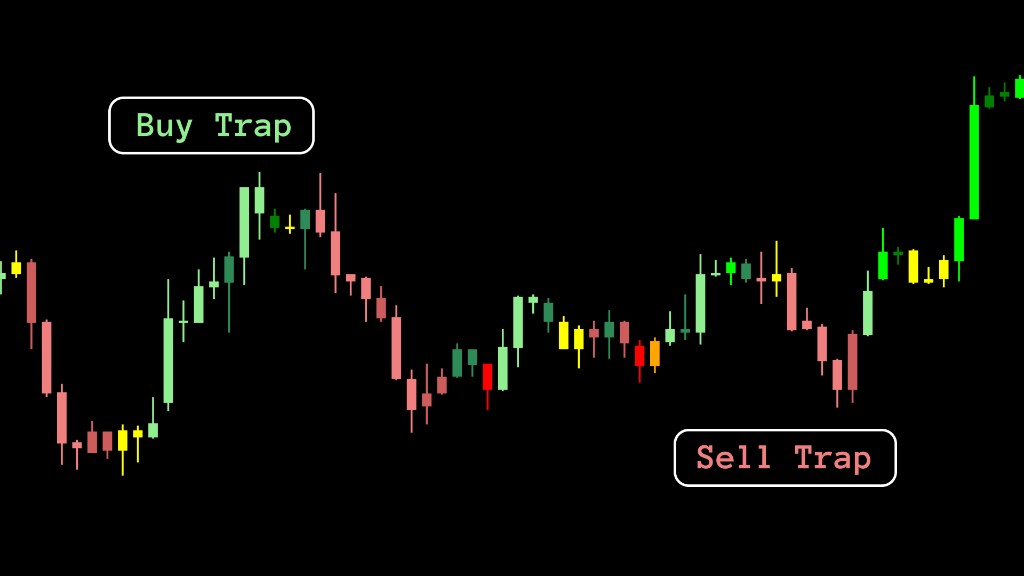
Highlights moves against the bigger trend or weakening momentum, so you can be more careful before entering a trade.
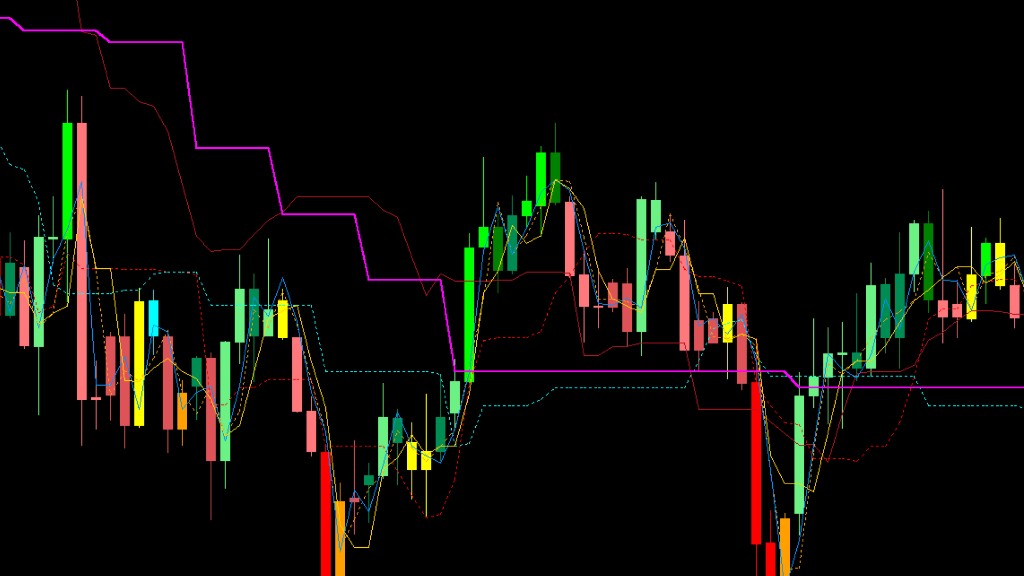
Tenkan lines for M15, M30, H1, H4, and D1, plus Kijun H4 and Senkou Span A H4, as support and resistance references.
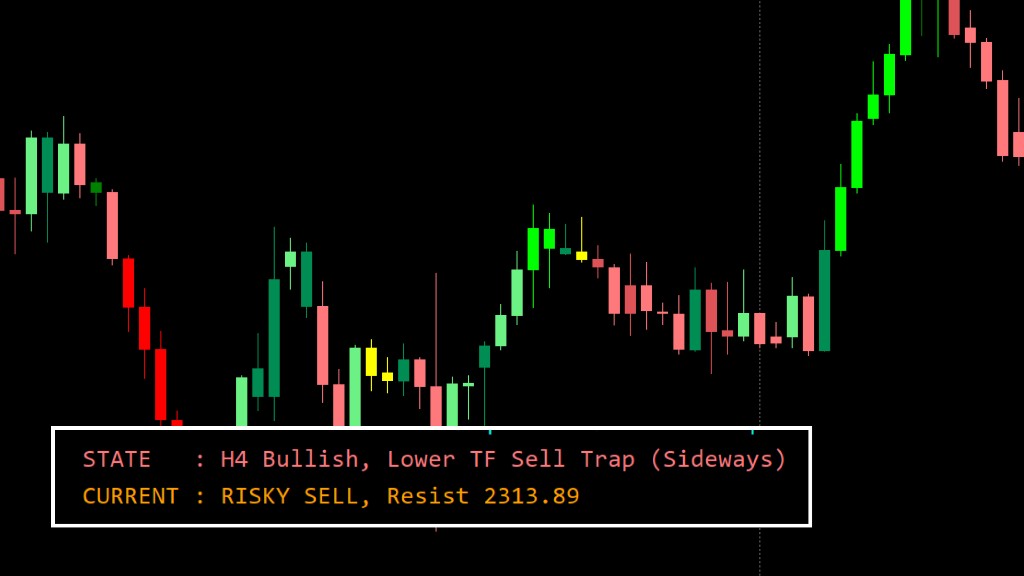
Replacing messy indicator lines with colors and additional panel on bottom-left for quick market summary.
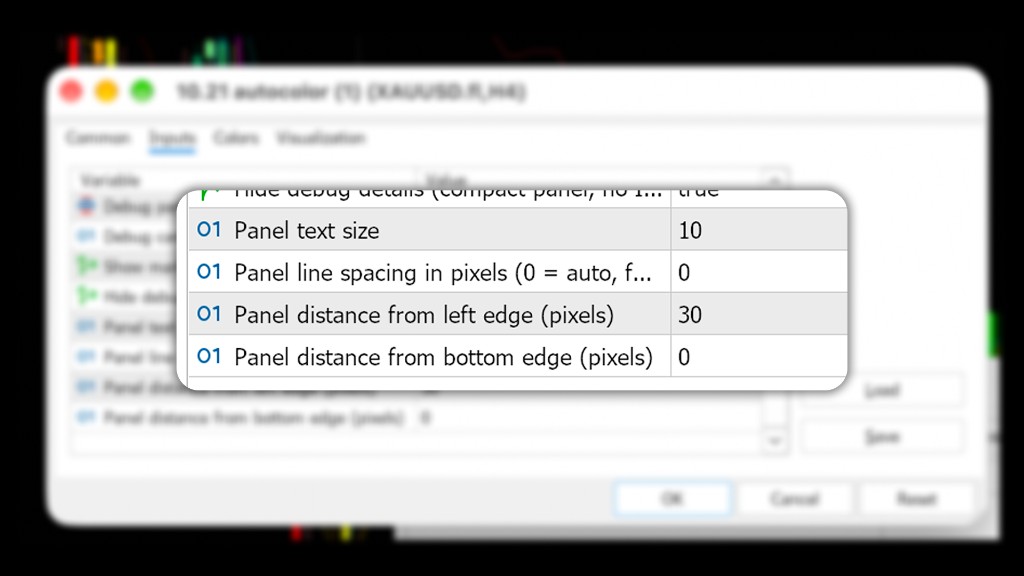
Panel text size and line spacing can be set manually, or adjusted automatically to your screen DPI.
| Color | Condition | Meaning |
|---|---|---|
| Lime | Bullish | All timeframes up |
| Aqua | Smart Buy | Correction over, time to buy |
| Green | Bullish Pullback M15 | Small dip within an uptrend |
| Red | Bearish | All timeframes down |
| Violet | Smart Sell | Bounce over, time to sell |
| Orange | Bearish Pullback M15 | Small bounce within a downtrend |
| Light green | Buy Trap / Bearish Correction M30 | Rally against the trend, be careful |
| Light coral | Sell Trap / Bullish Correction M30 | Drop against the trend, be careful |
| Sea green | Sideways High | Sideways above the cloud |
| Indian red | Sideways Low | Sideways below the cloud |
| Yellow | Neutral | Wait, no clear direction |
Built for gold on MetaTrader—same candle language as the web live chart when you choose Web, MT, or a bundle.
Live chart on web, MetaTrader file only, or both in one bundle—pick Personal or Business for the bundle in your cart. Upgrade credit applies if you already subscribe to web or MT separately.


XAU/USD is one of the most volatile instruments in financial markets. No tool or indicator on earth forecasts the future with 100% accuracy.
Lukisan Emas is not built to promise magic win rates. We take complex technical calculations and simplify them into an intuitive candle color spectrum—on the web live chart or your MetaTrader terminal.
Our goal is simple: help you execute your trading plan faster, with calm, and with discipline around risk—while enjoying aesthetic chart motion on MT.
Risk warning & disclaimer: Trading XAU/USD (gold) involves substantial financial risk and may not suit every investor. Lukisan Emas is a chart visualization and technical decision-support tool, not financial advice or fund management. Past performance does not guarantee future results.